How to Read Cryptocurrency Charts and Price Movements
Ever looked at a cryptocurrency price chart and felt completely lost? You’re not alone.
For many beginners, those fluctuating lines, candlesticks, and technical indicators can seem like an unreadable foreign language. But the truth is, learning to read crypto charts can give you a serious edge whether you’re investing for the long term or trading short term.
In this beginner-friendly guide, we’ll break down the basics of reading cryptocurrency charts, explain key patterns and indicators, and help you make sense of price movements.
Why Crypto Charts Matter
Crypto is a 24/7, fast-moving market. Price charts give you:
-
A visual snapshot of how prices are moving over time
-
Signals about possible future trends
-
Insight into market psychology (fear, greed, uncertainty)
Learning to read charts is a crucial skill for:
✅ Timing your buys and sells
✅ Spotting trends and reversals
✅ Avoiding impulsive decisions
🕹️ Types of Cryptocurrency Charts
1. Line Chart
-
Plots a line based on the closing prices over time.
-
Great for beginners to see overall trends.
-
Lacks detail on intra-day price action.
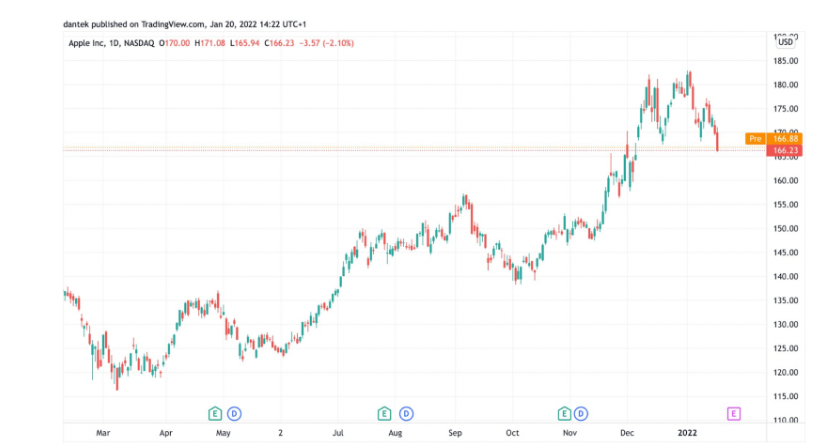
2. Candlestick Chart (Most Popular)
-
Shows open, high, low, and close (OHLC) prices.
-
Each “candlestick” represents a time period (e.g., 1 minute, 1 hour, 1 day).
-
Offers deeper insight into market sentiment.
🔍 How to Read a Candlestick
Each candlestick has:
-
Body: The range between open and close
-
Wicks (shadows): The highs and lows during the time period
-
Color:
-
🟩 Green (or white): Price closed higher than it opened
-
🟥 Red (or black): Price closed lower than it opened
-
Example:
If a 1-hour candlestick is green with a long wick at the top, it means buyers pushed the price up, but sellers later drove it down before the hour ended.
📈 Basic Chart Patterns to Know
-
Uptrend (Bullish)
-
Series of higher highs and higher lows
-
Suggests strong buyer interest
-
-
Downtrend (Bearish)
-
Series of lower highs and lower lows
-
Indicates seller dominance
-
-
Sideways/Consolidation
-
Price moves in a narrow range
-
Signals indecision or buildup before a breakout
-
⚒️ Key Technical Indicators
1. Moving Averages (MA)
-
Smooths out price data to identify trends
-
Simple MA (SMA) and Exponential MA (EMA) are most common
-
Used to confirm uptrends or downtrends
2. Relative Strength Index (RSI)
-
Measures momentum and identifies overbought/oversold conditions
-
RSI > 70 = overbought (price might drop)
-
RSI < 30 = oversold (price might rise)
3. MACD (Moving Average Convergence Divergence)
-
A momentum indicator that shows trend direction and strength
-
Helps spot reversals and entry/exit points
4. Volume
-
Shows how much crypto was traded in a specific time period
-
High volume = strong interest
-
Low volume = weak or indecisive market
🔎 Support and Resistance Levels
-
Support: A price level where demand tends to keep the price from falling further
-
Resistance: A price level where selling tends to prevent further price increase
These levels are like psychological “floors” and “ceilings” that prices often bounce off or break through.
🧠 Bonus Tips for Beginners
-
📆 Start with longer timeframes (like daily or weekly) to see bigger trends
-
📈 Don’t trade based on emotion or hype
-
🧰 Use multiple indicators together for better accuracy
-
🧪 Practice on demo accounts before using real money
-
📚 Keep learning — charts are just one piece of the puzzle
Final Thoughts
Reading crypto charts isn’t about predicting the future — it’s about making informed decisions based on patterns, momentum, and market behavior.
Whether you’re investing for the long term or trading for quick gains, chart analysis is a skill that pays off with practice and patience.
Remember: even the best analysis can’t guarantee outcomes — always manage risk and never invest more than you can afford to lose.


