

How to Read and Analyze Forex Chart (For Beginners)
Entering the world of forex trading can feel overwhelming at first, especially when faced with complex-looking price charts and unfamiliar terms. But don’t worry learning how to read and analyze a forex chart is one of the most important skills you’ll develop as a trader. Once you understand the basics, charts become your best friend, helping you spot trading opportunities and make smart decisions.
In this blog post, we’ll break down how to read and analyze forex charts step by step, using simple language that beginners can understand.
What Is a Forex Chart?
A forex chart shows the price movement of a currency pair over a selected period of time. For example, a chart of EUR/USD might show how the Euro is performing against the US Dollar.
You’ll use forex charts to:
-
Identify trends (is price going up or down?)
-
Spot patterns (like double tops or support/resistance)
-
Decide when to buy or sell
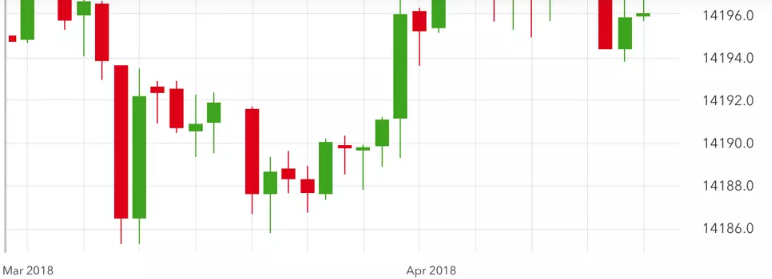
Most forex charts are displayed using candlesticks, which give more information than simple line charts.
How to Read Candlestick Charts
Each candlestick represents price movement during a specific time frame (e.g., 1 minute, 1 hour, 1 day).
A candlestick has:
-
Open: The price when the candle started
-
Close: The price when the candle ended
-
High: The highest price during that period
-
Low: The lowest price during that period
Candles are usually:
-
Green (or white) if the price closed higher (bullish)
-
Red (or black) if the price closed lower (bearish)
Example:
-
A green candle = buyers were in control
-
A red candle = sellers dominated that time period
Choosing a Time Frame
Forex charts let you choose from multiple time frames, depending on your trading style:
| Time Frame | Use Case |
|---|---|
| 1M – 15M | Scalping (quick trades) |
| 1H – 4H | Intraday/swing trading |
| 1D – 1W | Long-term trading or analysis |
For beginners, start with the 1-hour or 4-hour chart. It gives a balance between clarity and trade opportunities.
Understanding Currency Pairs
A forex chart always shows two currencies: the base and the quote.
Example: EUR/USD
-
EUR = Base currency
-
USD = Quote currency
-
If EUR/USD = 1.1000, it means 1 Euro = 1.10 USD
If the chart is going up, the base currency is strengthening.
If the chart is going down, the base currency is weakening.
Identifying Trends
A trend is the overall direction of the market. There are three main types:
-
Uptrend: Higher highs and higher lows
🔼 Look for opportunities to buy (go long) -
Downtrend: Lower highs and lower lows
🔽 Look for opportunities to sell (go short) -
Sideways/Range-bound: Price moves between support and resistance
↔️ Wait for a breakout or trade the range
Use trendlines and moving averages to help identify and confirm trends.
Key Tools for Chart Analysis
-
Support and Resistance
-
Support: A level where price tends to stop falling
-
Resistance: A level where price tends to stop rising
-
Traders watch these areas to plan entries or exits
-
-
Technical Indicators
-
Moving Averages: Smooth out price data to identify trends
-
RSI (Relative Strength Index): Shows if a pair is overbought or oversold
-
MACD: Helps with trend confirmation and momentum
-
-
Chart Patterns
-
Double Top/Bottom: Reversal signals
-
Head and Shoulders: Bearish reversal pattern
-
Triangles and Flags: Continuation patterns
-
As a beginner, focus on just a few patterns and indicators to avoid confusion.
Basic Steps to Analyze a Forex Chart: How to Read and Analyze Forex Chart
-
Identify the time frame you want to trade
-
Check the trend: Up, down, or sideways?
-
Mark key support and resistance levels
-
Use indicators to confirm your view
-
Look for price action patterns or signals
-
Plan your entry, stop loss, and take profit
Tools You’ll Need: How to Read and Analyze Forex Chart
-
MetaTrader 4 or 5 (MT4/MT5): The most popular trading platforms
-
TradingView: Great for chart analysis with a clean interface
-
Notebook or journal: Track your ideas and progress
✅ Final Thoughts on How to Read and Analyze Forex Chart
Learning how to read and analyze forex charts is not as scary as it looks. With consistent practice, the charts will start to “talk” to you. The key is to start simple focus on one chart, one time frame, and one strategy. Build your skills slowly and avoid information overload.
Remember: The chart is just a tool. Your success depends on how well you use it.